Back in 2018, California had to face a devastating camp fire that burned approximately 621 square kilometres. As I read through the article in Wikipedia I came to know that it was the deadliest wildfire in the United States since the Cloquet fire in 1918. I wanted to see how the area looked before, during and after the Camp Fire. So I fired up Earth Engine on my Jupyter Lab notebook and started coding.
And here's how the final output looks like:
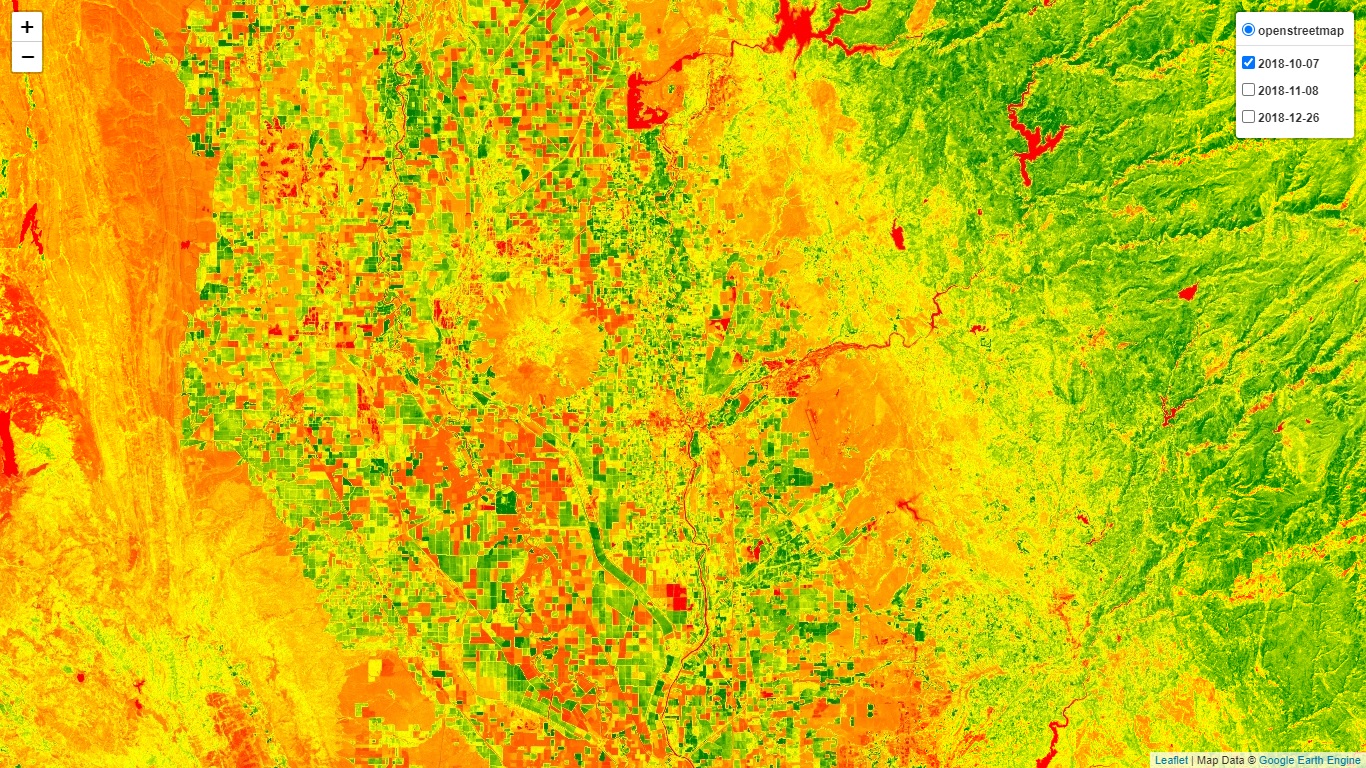
Before Camp Fire:
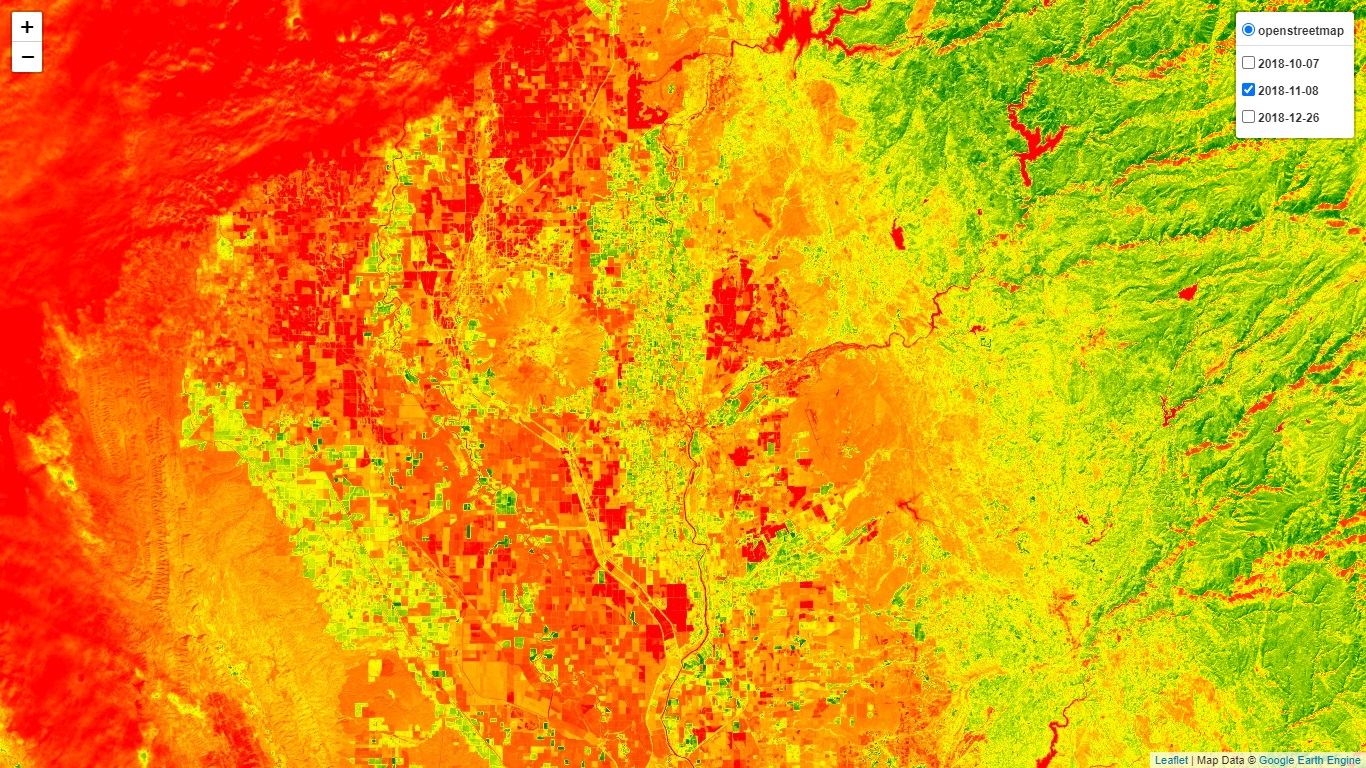
During Camp Fire:
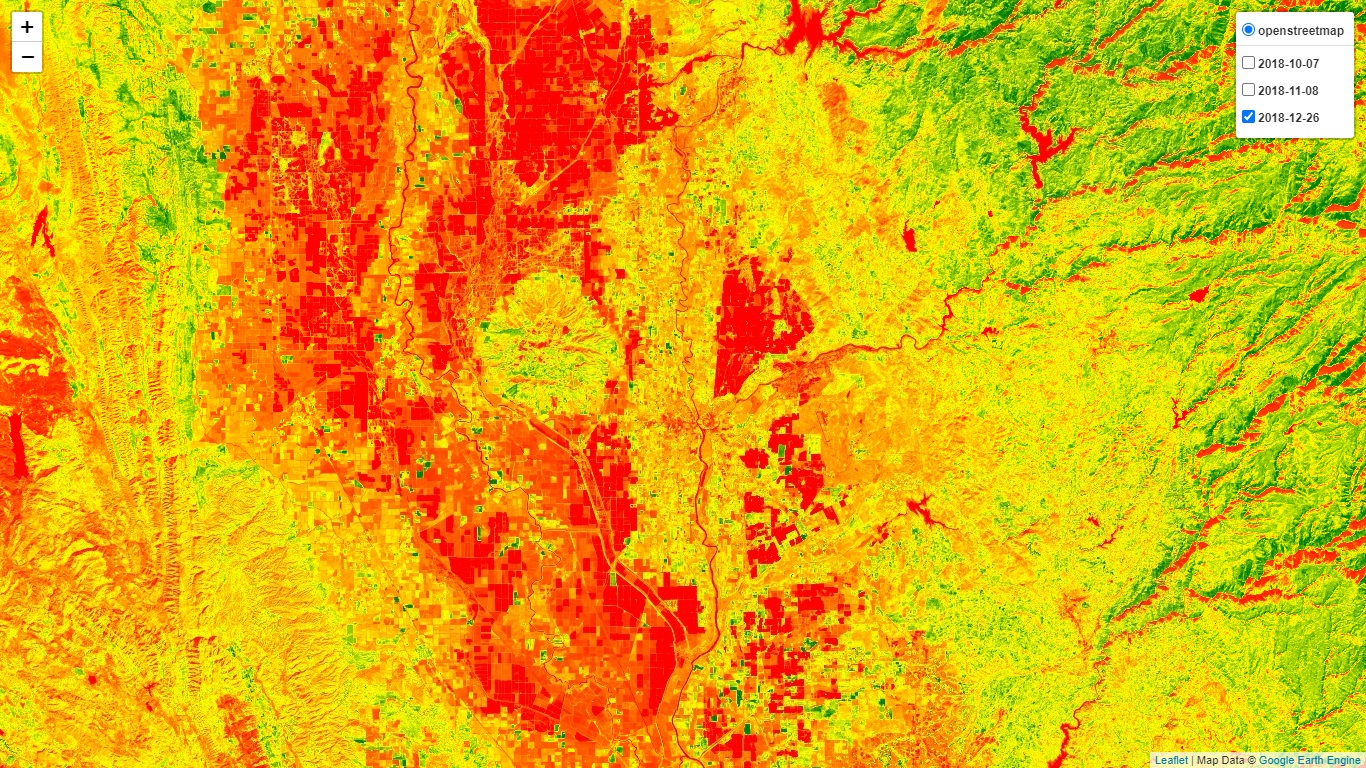
After Camp Fire:
I wanted to make it interactive so I used Folium with it. Which is an amazing library that uses Leaflet to render an HTML file with the Earth Engine output. If you want to learn how I created this map here's my jupyter notebook that you can tinker with. I left some comments and markdown notes as well just in case you wanted know why I did that particular thing.
But if you just want the script here's the whole code:
import ee
import folium
ee.Authenticate()
ee.Initialize()
lat = 39.444012
lon = -121.833619
def add_ee_layer(self, ee_image_object, vis_params, name):
map_id_dict = ee.Image(ee_image_object).getMapId(vis_params)
folium.raster_layers.TileLayer(
tiles=map_id_dict['tile_fetcher'].url_format,
name=name,
attr='Map Data © <a href="https://earthengine.google.com/">Google Earth Engine</a>',
overlay=True,
control=True
).add_to(self)
folium.Map.add_ee_layer = add_ee_layer
landsat_sequence = [0,2,5]
poi = ee.Geometry.Point(lon,lat)
start_date = '2018-10-01'
end_date = '2019-01-31'
landsat = ee.ImageCollection("LANDSAT/LC08/C02/T1_L2").filterBounds(poi).filterDate(start_date, end_date)
landsat_list = landsat.toList(landsat.size())
roi = poi.buffer(20000)
palette = ['red', 'yellow', 'green']
ndvi_parameters = {'min': 0,
'max': 0.4,
'dimensions': 512,
'palette': palette,
'region': roi}
my_map = folium.Map(location=[lat, lon], zoom_start=10)
for i in landsat_sequence:
date = ee.Image(landsat_list.get(i)).get('DATE_ACQUIRED').getInfo()
my_map.add_ee_layer(ee.Image(landsat_list.get(i)).normalizedDifference(['SR_B5', 'SR_B4']),
ndvi_parameters,
name=date)
folium.LayerControl(collapsed = False).add_to(my_map)
display(my_map)
my_map.save('index.html')
That's it! I hope you understood the way I've made the visualization. If you have any question feel free to reach out to me anytime!